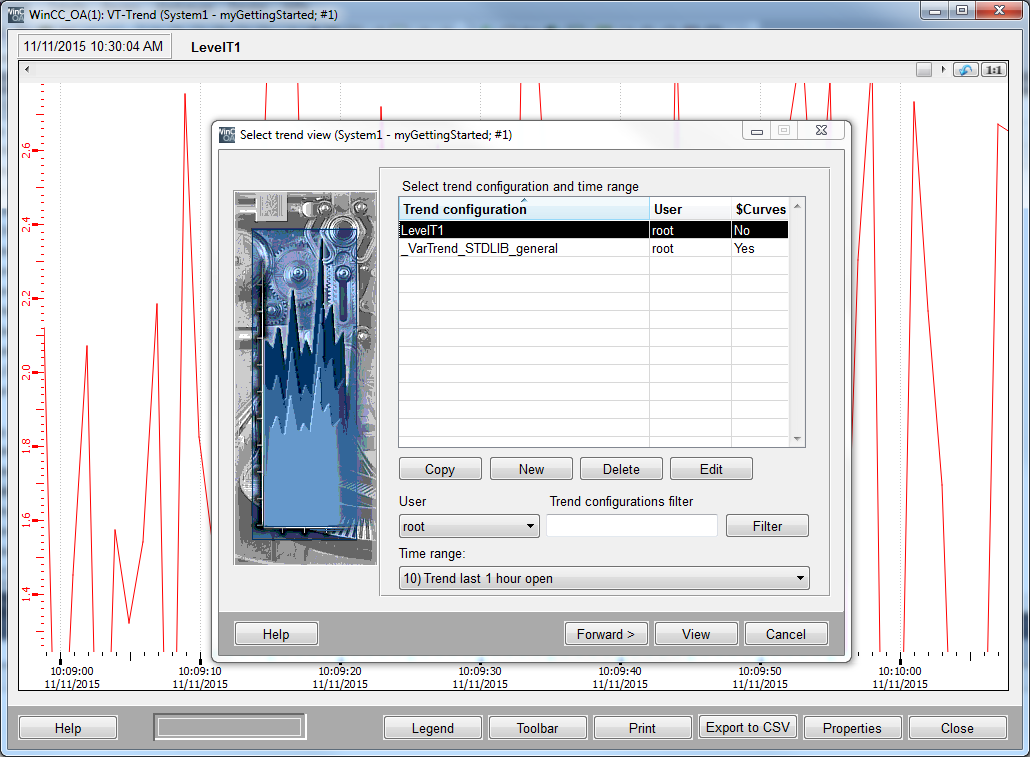
Variable Trend
The trend was used as configurable comprehensive graphic object in the last chapter. A high-order tool variable trend is available for displaying value-time progresses.
Unlike described in the chapter Display historic Data using Trends the variable trend can be used to display arbitrary curves and groups of curves. You can configure what curves should be displayed over a specific period at runtime (in the user interface /module Vision). Such combinations can also be saved as configurations and the user can open his "general" views easily through a mouse click.

You can open the variable trend over the System management panel > Diagnostics > Variable Trend. You can, of course, also use an arbitrary button for this call. In the panel topology (see Panel topology) that will be described later, a button that opens the variable trend already exists.
For more information on the variable trend, see chapter Variable trend, basics.


