Trend display of compressed data point elements
The WinCC OA Trend provides the graphical visualization of value changes over a free selectable time range. The view can take place either in a curve graphic, bar graphic etc. Up to 16 WinCC OA data point elements can be displayed in one trend window.
In the trend also the compressed values of a compression calculation can be displayed and can be combined with not compressed data point element values. The curves are configured as usual. The only difference is the selection of the data point element, whose values should be displayed via a curve in the trend.
Compressed values cannot be displayed online in the trend. This means that once the trend has been opened, new compressed values are written to the database, but they are not reflected in the trend. To see the current compressed data, the trend must be closed and reopened.
The return data point type of compressed values is float in order to display AVG (average values) for int values correctly.
How to display compressed values in the trend is shown by the means of the following example. The data point elements of the Valve.Valve_R1 data point are used. This has already been created in the example on Mass Configuration of multiple Data Point Elements.
 This is how to display compressed values in the
trend
-
Open the trend configuration of the trend. in which the compressed values should be displayed.
-
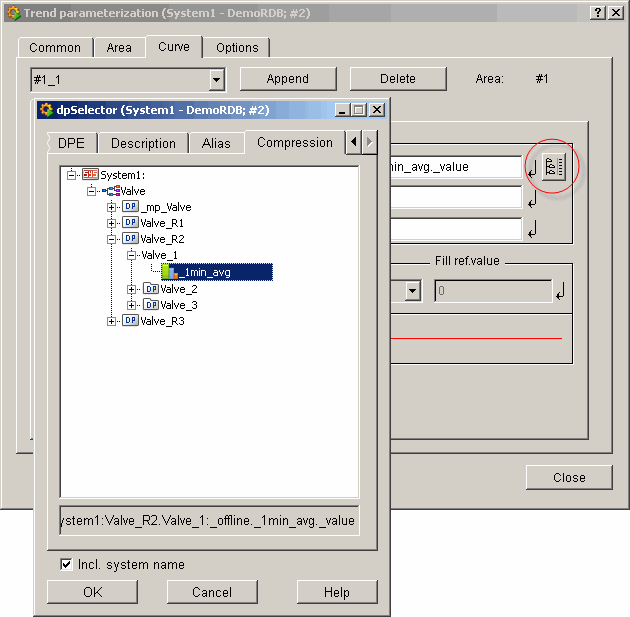
Click the
 button in the
General tab to open the DP selector.
 -
Select the compression calculation of the Valve_R2.Valve_1 data point element in the Compression tab of the DP selector and click OK to confirm.

-
Click on the Append button in the trend configuration to define a second curve.
-
Repeat for the second curve the steps 2 to 3. This time select the compression calculation of the data point element Valve_R2.Valve_2.Valve_2_1.
-
Repeat the steps 4 and 5 for the compression calculation of the Valve_R2.Valve_3.Valve_3_1.Valve_3_1_1 data point element.
-
Close the trend configuration and open the trend.
-
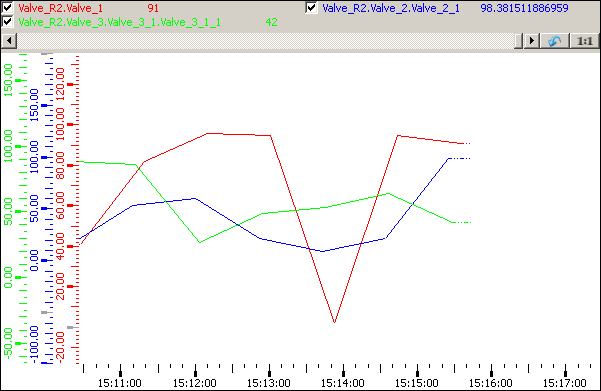
The average values from the compression calculation are minutely displayed in the trend:

Please note that for the display in the trend the compression calculation and the appropriate compression step and compression interval have to be activated.


