Requirements and Installation - InfluxDB® and Grafana®
- InfluxDB® Version 1.8.
- Grafana® version 9.1.2 or higher - see https://grafana.com/.
Installation of Grafana® and dashboard
Installation of Grafana®
- Download the installer under Windows (https://grafana.com/). Open and run the
installer and install all features:
Figure 1. Windows Installer - Grafana® 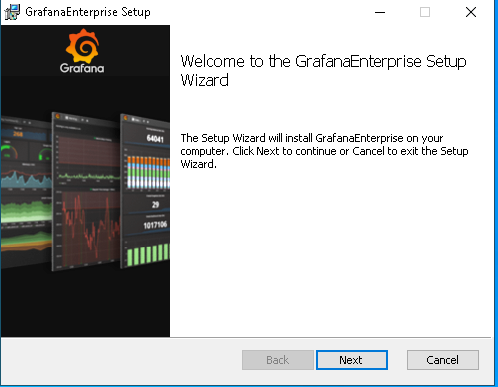
- Run the following command to install Grafana® under Linux:
wget https://dl.grafana.com/enterprise/release/grafana-enterprise-9.1.4-1.x86_64.rpmsudo yum install grafana-enterprise-9.1.4-1.x86_64.rp
For more information, see https://grafana.com/ and https://grafana.com/grafana/download?platform=linux.
Grafana® Service under Windows
- Check that the Grafana® service runs via :
Figure 2. Grafana® Service 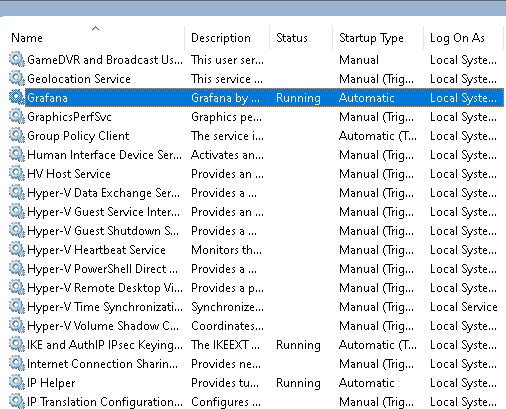
Grafana® Service under Linux
- To start Grafana®, complete the following
steps:
sudo systemctl enable Grafana-server.service ( Grafana service to restart at boot) sudo systemctl start Grafana-server (start the Grafana service) - Check that Grafana®
runs:
sudo systemctl status Grafana-server (Check the status of service)