 "data" -
Element array
Specifies the data for the bar trend in the element array display mode.
Synopsis
setValue(string shape, "data", dyn_float avg, dyn_float max, dyn_float min,
                    dyn_float s);
getValue(string shape, "data", dyn_float &avg, dyn_float &max,
                    dyn_float &min, dyn_float &s);
shape.data(dyn_float avg, dyn_float max, dyn_float min, dyn_float
                    s);
Parameters
| Parameter | Description |
|---|---|
| shape | Name of the object |
| avg | Array of average values |
| max | Array of maximum values |
| min | Array of minimum values |
| s | Array containing s values |
Description
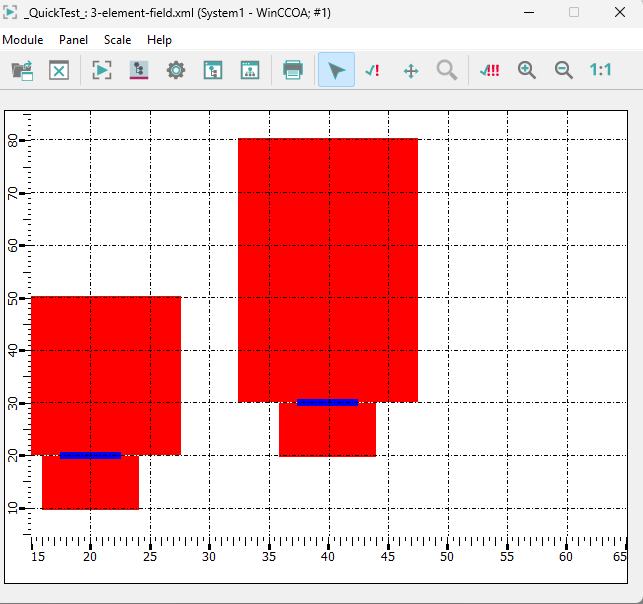
This attribute is used to define the values for the element array, with four arrays being passed.
Example
main()
{
  shape bt=getShape("BAR_TREND1");
  bt.Type=3;
  // https://winccoa-docu-internal.siemens.net:8443/help/main/3.20/core/en/Control_Grafik/data_EA.html
  dyn_float davg, dmax, dmin, ds;
  // Values
  davg = makeDynFloat(20, 30);
  dmax = makeDynFloat(50, 80);
  dmin = makeDynFloat(10, 20);
  ds = makeDynFloat(30, 90);
  // Setting the values
  setValue(bt, "data", davg, dmax, dmin, ds);
  // Start point for the bars on the X-axis
  bt.xStart = 10;
  // Width of the bars
  bt.xWidth = 20;
  // Displays all values
  bt.showRange = BAR_MINMAX;
  // Height of the average value bar
  bt.heightCenter = 5;
  // Width of the ranges
  bt.widthCenter = 5;
  bt.widthTop = 15;
  bt.widthBottom = 8;
  // Colors of the ranges
  bt.colorTop = "Red";
  bt.colorBottom = "Green";
  bt.colorCenter = "Blue";

  bt.xCenter(15);
  bt.xRange(50);
  bt.xStep(5);
  bt.yCenter(45);
  bt.yRange(180);
  bt.yStep(10);
  }


