Prometheus Interface
The Prometheus interface (also referred to as Prometheus client) serves as a bridge between WinCC OA and Prometheus. It facilitates the retrieval, processing, and exposure of data from the WinCC OA system to a Prometheus-compatible format. This allows Prometheus to monitor and alert based on the data fetched from the WinCC OA system.
Key Features
YAML-Based Configuration
The library uses YAML files to define the metrics and datapoints that need to be monitored. This approach allows for flexible and dynamic configuration, making it easy to specify what data should be exposed to Prometheus.
Custom Commands and Tags
The client interprets specific tags in the YAML file as custom commands (e.g., !dpGet, !dpConnect, !dpQuery, and !globalVariable). These are used to fetch data, establish connections to datapoints, execute SQL-like queries, and reference global variables, respectively.
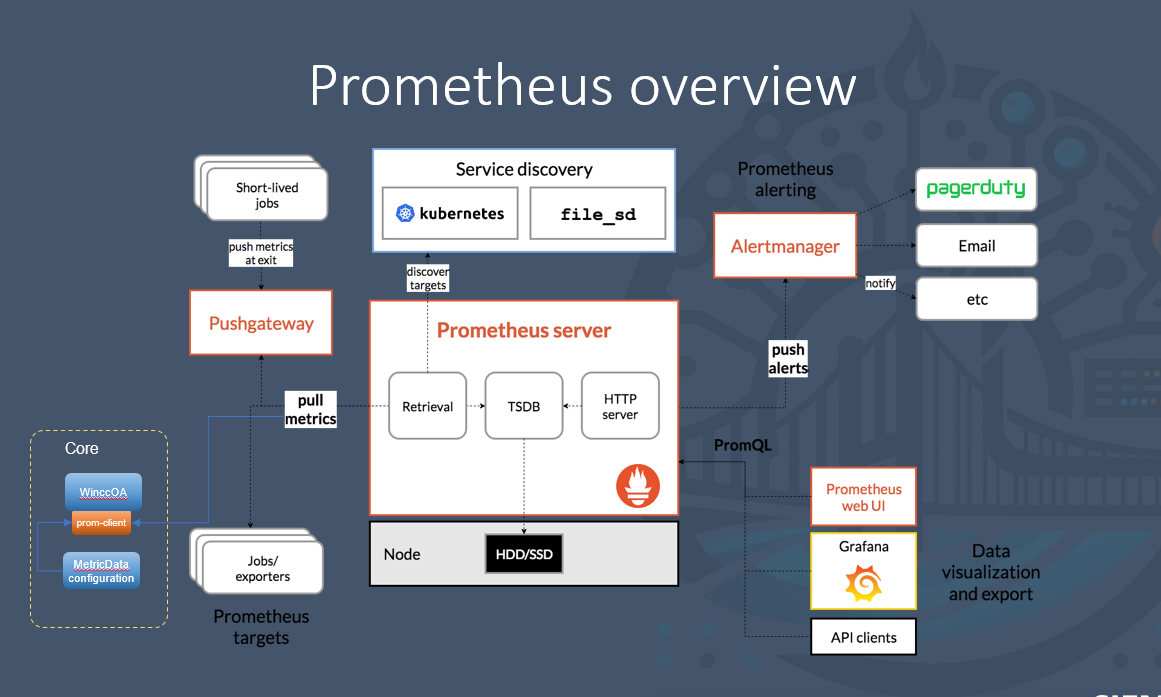
Introduction to Prometheus
Prometheus is an open-source monitoring and alerting toolkit, widely used for its simplicity, robustness and effectiveness in handling time-series data. It collects and stores metrics
as time-series data, meaning data that is stored along with the time stamp at which it was recorded. Metrics can be queried using PromQL, a flexible query language offered by
Prometheus.