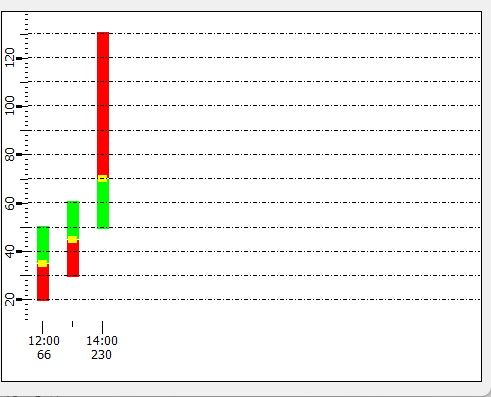
"colorTop" - Time element array
Color of the bar element above the average value section.
Synopsis
setValue(string shape, "colorTop", string color);
getValue(string shape, "colorTop", string &color);
shape.colorTop(string color);
Parameters
| Parameter | Description |
|---|---|
| shape | Name of the object |
| color | Color string |
Description
This attribute is used to specify the color of the bar element above the average value section.
Example
main()
{
  shape bt=getShape("BAR_TREND1");
  dyn_float min, max, avg, s;
  dyn_int meter;
  dyn_long tVariable;
  // Values
  min=makeDynFloat(20, 30, 50);
  max=makeDynFloat(50, 60, 130);
  avg=makeDynFloat(35, 45, 70);
  s=makeDynFloat(10, 20, 30);
  tVariable=makeDynLong(makeTime(2000, 20, 9, 12, 00), makeTime(2000, 29, 9, 13, 00), makeTime(2001, 2, 4, 14, 00));
  meter=makeDynInt(66, 180, 230);
  // Setting the values
  setValue(bt, "data", avg, max, min, s, tVariable, meter);
  // Minimum and maximum value display
  bt.showRange=BAR_MINMAX;
  // Width of the bar sections
  bt.widthTop=10;
  bt.widthBottom=10;
  bt.widthCenter=7;
  // Set colors
  bt.colorTop="Green";
  bt.colorBottom="Green";
  bt.colorCenter="[100,100,0]";

  bt.yCenter(75);
  bt.yRange(170);
  bt.yStep(10);

  bt.xStep(1);
  bt.xWidth(30);

  // Update bar trend
  bt.flush();
}
Assignment
Bar trend


