Buttons
Furthermore the panel contains the following buttons. Note that you can also use F keys to operate the buttons:
 Pauses the script. You can also use the Pause button of the keyboard.
 Continues the execution of the script (Hotkey: F5)
Jumps to the function that is currently executed or to the next line when the code that is executed does not contain a function (Hotkey: F8)
 Break All Threads (Shift + pause) if several threads are running, then these are paused.
 Continue all Threads (Shift + F5) If several threads are paused, these can be continued using
this button.
 Step Over (F10) only executes the current line of code.
 Step into (F11) jumps directly into the function that is called and not into the next code
line/execution. It can be used to step into the function and to go through it step by step.
 Step out (Shift + F11) jumps directly back to the calling function and not to the next line. It can be
used to step into the function and not to go through it step by step, but to jump back to the point from which you jumped in.
 Jumps to the current line (Hotkey: F12)
 Deletes all breakpoints (Hotkey: Strg + F9).
In the script window the F9 key sets a breakpoint.
 Opens the online help.
If the content of a script is not shown in the main window, the script is encrypted!
If the CTRL debugger is stopped, the last edited managers remain in their debug state, for example, stopped or single step mode. If a manager is restarted, the manager resumes to normal mode again.
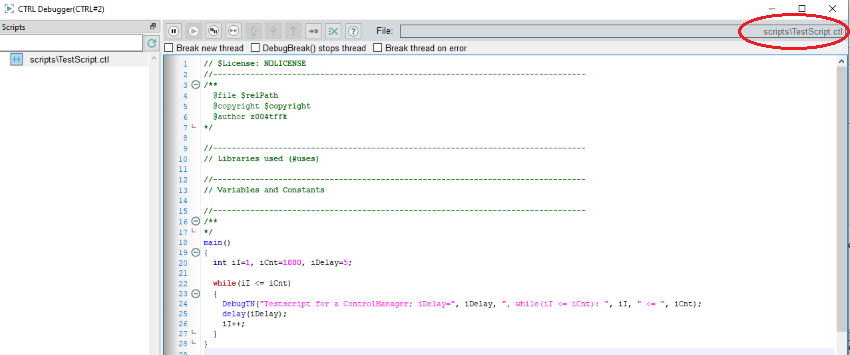
By clicking a script or a panel in a tree (see the figure Scripts in the tree view), the events of scripts, panels and graphic objects can be opened. For panel scripts the module name, the object name as well as the event name are shown under the panel name. A click on an event or a click on a library name (see figure CTRL libraries in the tree view) shows the code on the right in the main window. You can now debug the code. Use the buttons to debug the scripts. Note that the a script cannot be changed here. In order to change a script, double-click a script on the top right in the CTRL debugger window (see figure below) and the script is opened in the script editor. Edit the script in the original file. The same applies to panels, double-click a panel name in order to open a panel in the GEDI.

