Script Window


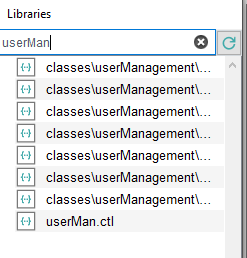
You can use the search window to search for scripts, libraries, variables and breakpoints. The search is case insensitive! Without wildcards, for example, "settings" is part of a word and all words containing "settings" are found. With bsettings* = all words that begin with "bsettings" are found.
For Debugging of init scripts:
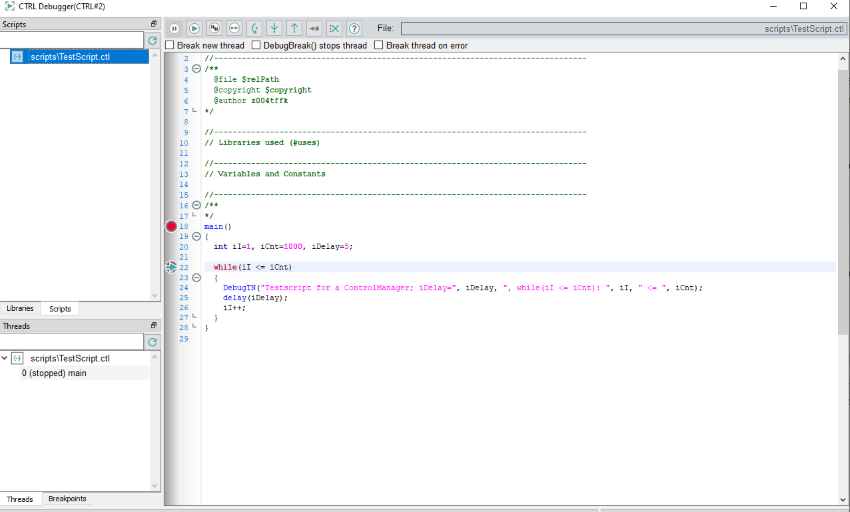
Break new thread: With the Break new thread the debugger stops on the first line. It waits and when you press a second time, the debugger is started. If a manager has not yet been started and you press the button, the manager does not yet execute, but waits until you start the CTRL debugger and click Continue. The option Start Manager for Debugging and break new Threads option in the WinCC OA console is the same as Break new thread.
Debug Break Stop Thread: Stops the execution of the code since DebugBreak() is set in the code. You have to set DebugBreak() explicitly in the code if you want to use it.
Break Thread on Error: Break Thread on error stops the execution of the code when an error occurs. It stops at the error.
Also Remote UI can be debugged.


